
God Jul! – Vrolijk Kerstfeest! – Merry Xmas! – Hyvää Joulua!
From all of us to all of you – A very Merry Christmas!

Want to Streamline your budget processes?
Planacy enables driver-based budgeting, increased collaboration and time savings. With Planacy you get control of your forecasts, empowering you to make proactive decisions. Watch the video for 4 examples of how you can work with revenue budgeting in Planacy or read more about how Planacy can automate and streamline your processes here.
22. Vizlib Custom Report in 10 Seconds
Set up a Custom Report in 10 seconds – watch the video to see how it’s done! With this powerful self-service solution and all-round reporting tool you have almost endless possibilities! The Vizlib Custom Report is part of the Self-Service package, read more about what’s included here.
Want to try it out for yourself? Sign up here for a free trial!
21. Write directly to a table in Snowflake from Qlik Sense with Vizlib Writeback Table
Vizlibs Writeback Table extension in combo with Qlik Application Automation is a quick way to get a workflow to write data in Qlik Sense SaaS. The Writeback Table is available in the Vizlib Collaboration package, read more about whats included in the package here.
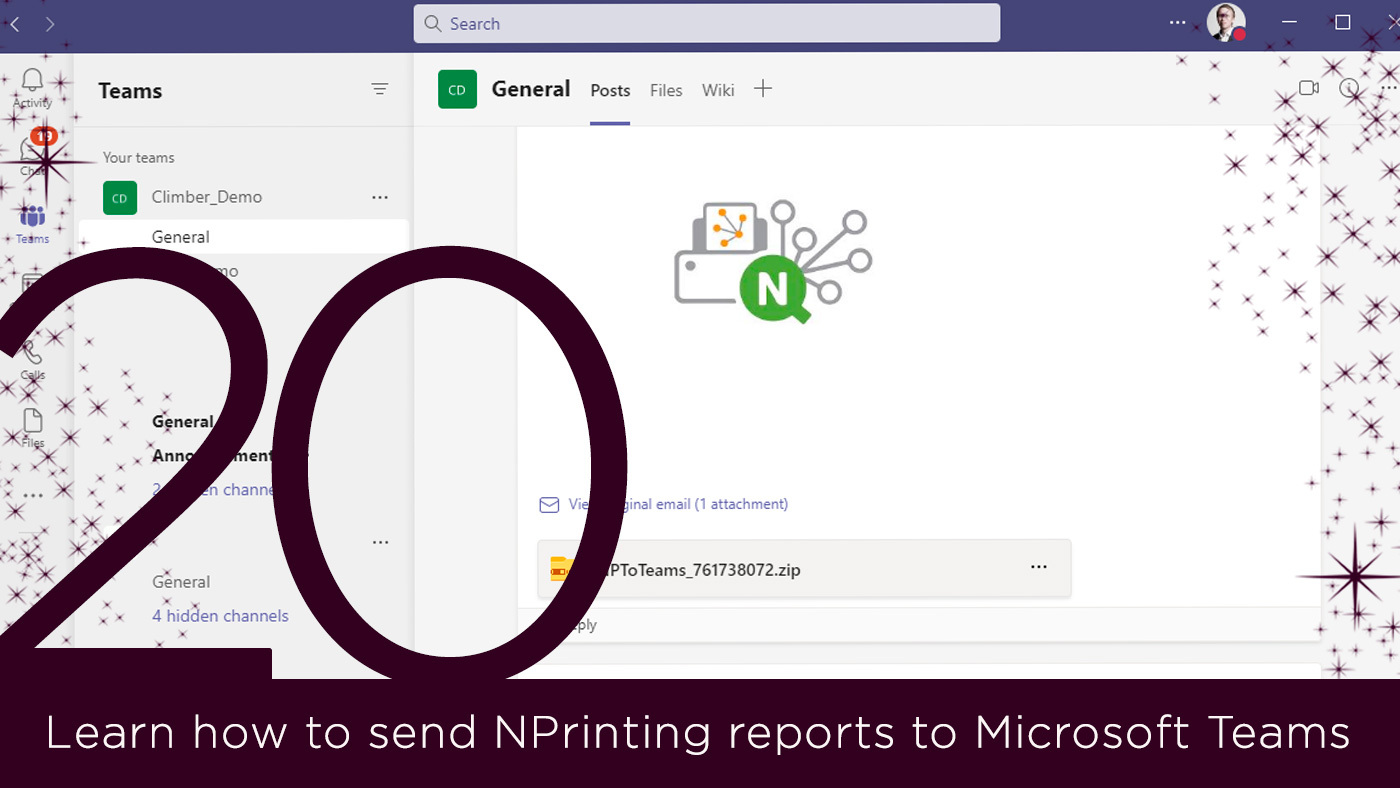
Did you know you can send NPrinting reports to Microsoft Teams?
A team created in Microsoft Teams can have several channels. These channels all have dedicated email addresses, which enable us to send NPrinting reports to any chosen Teams channel. The setup is very easy:
- Get the channel email address by right clicking on the channel name -> Get email address
- Create an NPrinting user with the email address and set it up as a recipient of publish tasks.
And you’re good to go!
19. Monitor in hub
Select a visualization and add it to your personal space in the cloud hub, the monitored visualization will update every time the source app reloads. When you open a chart in the hub, the chart shows the latest version of the chart from the last reload of data in the source app. You can view the chart, the chart details, and the history.
Want to learn more about all the new functionality in Qlik Cloud? Get in touch with our BI Manager Magnus Petersson-Ahrholt.
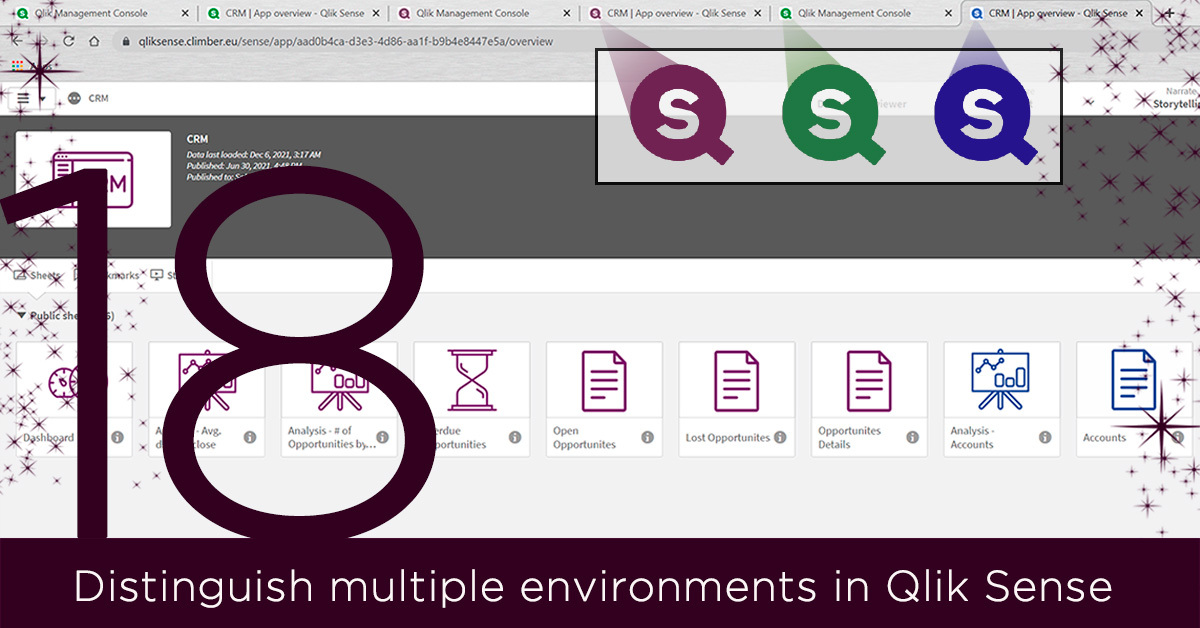
Distinguish different environments in Qlik Sense
Using tabs to switch between Qlik Sense environments and want to be able to quickly identify where you’re at? And avoid making errors, such as trying stuff out in prod that should have been tried out in test? We have a super simple solution for you – just change the color of the thumbnails to distinguish the different environments!
Qlik Data Integration keeps your analytics updated all the time
Did you know that with Qlik Data Integration you can keep your analytics data updated all the time, regardless if you are building a Qlik Analytics solution, a Data Lake or a Data Warehouse?
Tryout Qlik Data Integration with real-time Replication or contact our QDI-guy Olof Malmström to see how we can help you get faster time to insights!
Tired of reading in files with dummy data to Qlik Sense?
Then here is the tip of the year for you! Just use the keyboard shortcut Ctrl + 00 to generate a set of random data.
Leverage your existing AI & Machine Learning tools and models in Qlik Sense
It’s now possible to integrate Qlik Sense with other platforms that create advanced and predictive analytics. This allows you to use Qlik as a tool to process and feed data to your models, and bring the output to your business users who can analyze and act on the predictive data.
The three main ways to do this today are:
- Connect Qlik to you Python or R platform
- Use Cloud Automation’s to make real time predictions
- Use platform-specific connectors, for example SageMaker
Want to discuss how you could take advantage of this? Drop a line to BI Manager Daniel Häggroth.
Did you know that Section Access of users can be handled easy, smooth and safely in Qlik Sense with the help of Vizlib Writeback Table?
AD groups and users can be downloaded from your own environment. Then assign which role(s), units, cost centers or tabs users should have access to. Underlying information is by advantage retrieved from Qlik Sense for minimal maintenance and to reduce the risk of misspellings. Hover over the picture to learn more about Vizlib Writeback Table and Input Form.
Did you know that Alerts in Qlik Sense and Qlik’s mobile app can help you stay on top of what you find important in your data?
You can set up your own Alert, define what should trigger it and decide if you want the insights directly to your mobile or through email. Want to learn how? Watch the video or reach out to our BI Manager Magnus Petersson – Ahrholt.

12 is the magic number of 2021
12 new BI consultants chose to climb with us in the Swedish team. And a total of 6 new recruits in our other countries, Finland, the Netherlands and UK – Quite remarkable growth in times like these! We’re always looking for more talent. If you too want to be part of our team – check out our current job offerings!
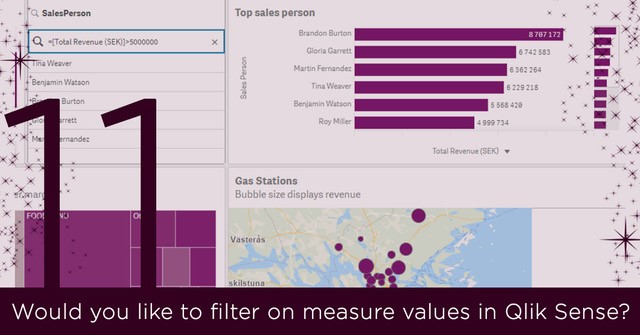
Did you know it’s possible to filter on measure values in Qlik Sense?
In this example, all sales people with a yearly sales over 5 million SEK
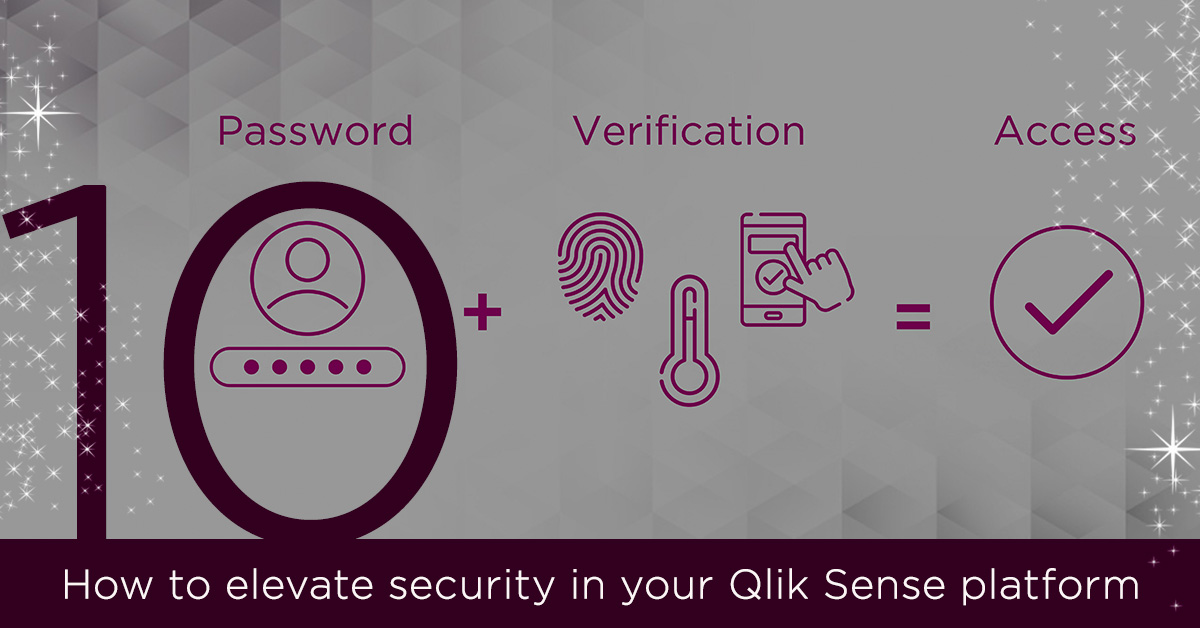
Want to Elevate Security in your Qlik Sense Platform?
By using Single Sign-on (SSO) you can enforce multi-factor authentication (MFA) in Qlik Sense. If you think this sounds interesting – please give us a call!
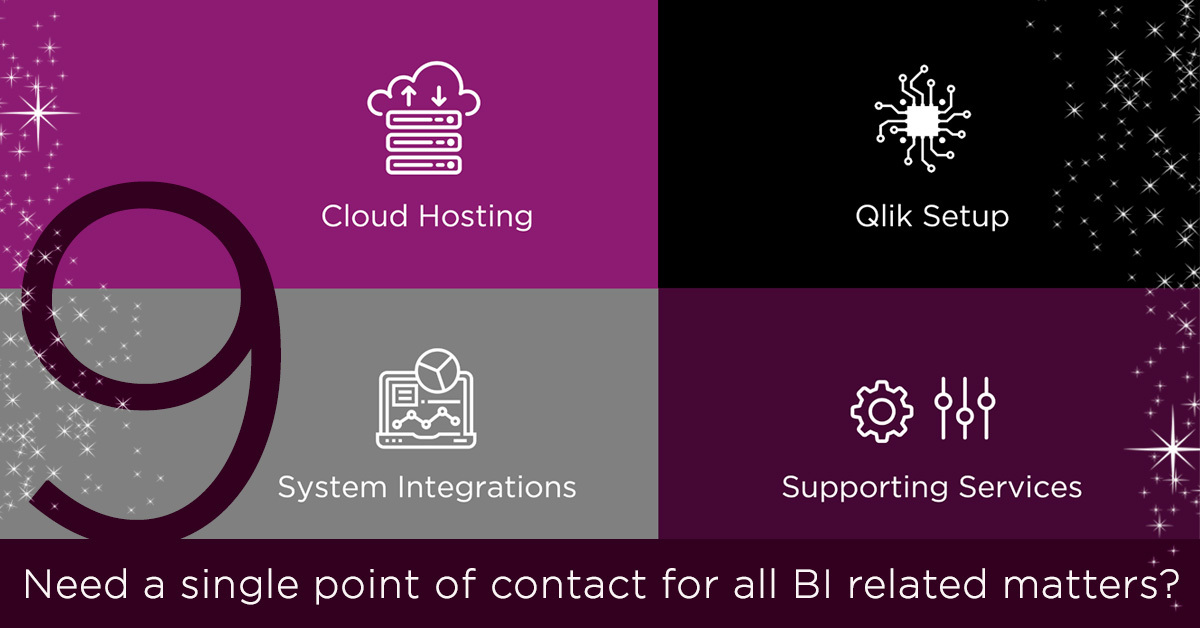
Managed Qlik Services by Climber
A seamless cloud service that is technology agnostic and provides a “one-stop-shop” for all things BI. Our Climber Expert Services team host and manage your set-up and your integrations, and will continually support and monitor your BI environment. Our hardware is designed for Qlik, and we’ll build a unique environment for you based on your needs. We optimise according to data sources, what system (AD) the users are in, where they are geographically, and how and what they are looking at.
You’ll get a dedicated contact who is responsible for ensuring that your hardware, operating systems, security, data sources and reloads for Qlik are optimised and work as they should. If any questions arise, you’ll know immediately who to contact. And you can be up and running in just a couple of days! Don’t hesitate to contact us!
Select Excluded
Do you want to select the other values except those already chosen, e.g. not having to select 33 individual gas stations to analyze all but top 3?
No problem, just use “Select excluded” – Watch the video to see how it’s done!
Did you know that you can add forecasting capabilities to Qlik Sense with just one click?
No coding or complex installation. Equipped with 3 modes, predictive, linear and scenario analysis, forecasting with Vizlib is now more powerful than ever. Want to see more? Hover over the picture to watch the video.
The Vizlib Line Chart is included in the Vizlib Library. Sign up here for a free trial!

Sweden’s leading Qlik Partner in Healthcare
Taking in account we analyze 6.5 million visits made by patients for some of Sweden’s largest healthcare providers, we dare stick out our chin and say we are the leading Qlik partner in Sweden for Healthcare.
If you too need help getting your data sorted – reach out to our expert in this sector: Daniel Häggroth.

How do you measure BI success?
It’s no secret – data-driven companies outperform their competitors. And while most companies use some form of BI solution today, many don’t know how to maximize their return on investment. While the answer is easy – by increasing employee engagement – getting everyone on board is not. We conducted a survey among our customers to understand how they use BI and how we can help them get more from their BI investment.
Take part of the results, and get 4 steps on how you can up BI usage in your organisation!
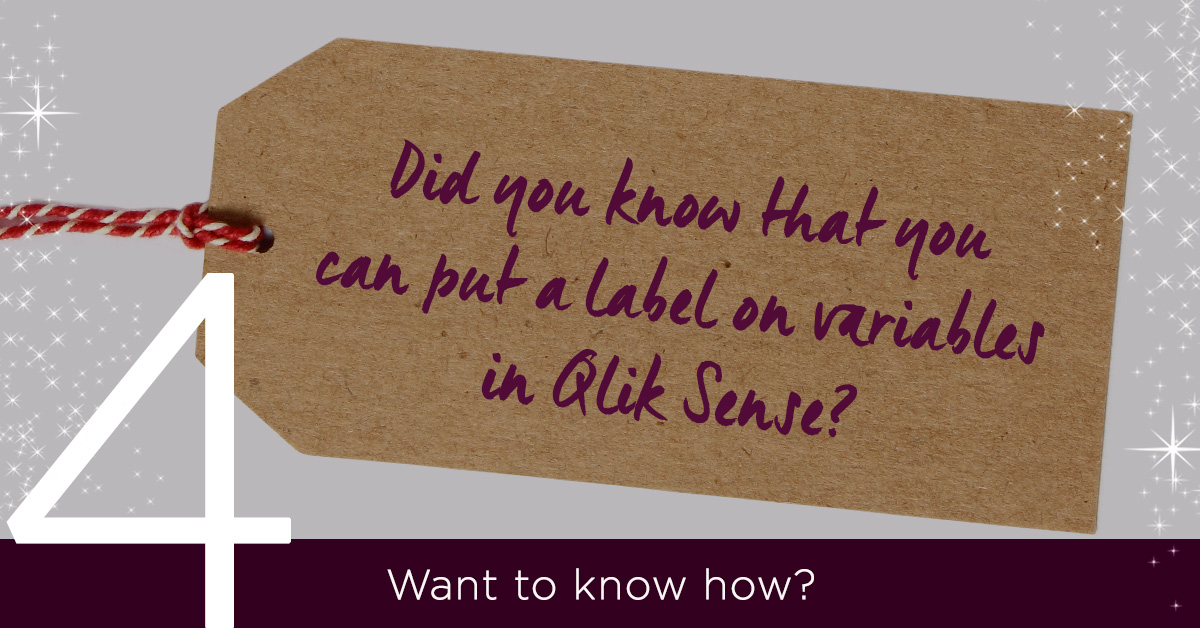
Did you know that you can put a label on variables in Qlik Sense?
When you list variables you separate them with | and use ~ to separate value and label, for example DK~ Denmark|SE~ Sweden
Interested in learning more? Check out our online training in Qlik Sense or contact us for a customised one!
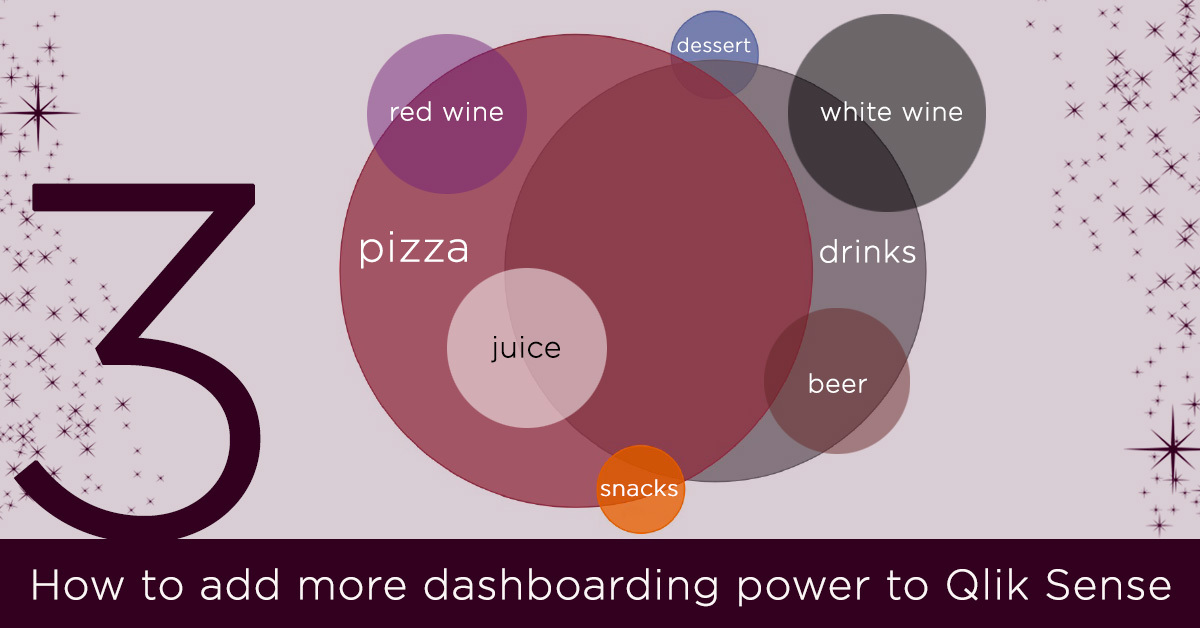
Vizlib Venn Diagram – excellent for displaying overlapping data
This highly customisable, supported and easy-to-use extension for Qlik Sense, gives the user ability to easily create a Venn Diagram. Simply drag and drop available dimensions and metrics, and immediately create visual representations of interrelations of data. The circle size, position and intersections are driven by the elements who may own one or more of the available attributes.
The Vizlib Venn Diagram is included in the Vizlib Library. Read more about the Vizlib Library Package here! Want to give it a spin? Contact us for a free trial!
Did you know it’s possible to see the figures behind a graph in Qlik Sense?
All you need to do is give it a right click!
Check out the video to see the magic!
Adopting next generation analytics capabilities has never been easier
You don’t even have to leave your QlikView solution behind. Get the best of both worlds through the Qlik Analytics Modernization Program, all your QlikView users get access to Qlik Sense. Choose to mix QlikView and Qlik Sense as you require, or migrate fully to Qlik Sense without any additional costs.
With Qlik’s Analytics Modernization Program you can:
- Implement Qlik Sense at your own pace, without changing the way you work with QlikView today
- Use any combination of SaaS, on-premises, or private cloud
- Sign up for three years and stay protected from Qlik’s annual price increases. Is three years a little long? Opt for a one year subscription with a 30% increase on your annual Qlik fee.
Try Qlik Sense for free here or contact our license-guru Eva Wallin
News

What’s New in Qlik Cloud – July 2024
This month’s updates in Qlik Cloud include Context Menu for Visualisations and On-Demand Tabular Reporting to mention a few. In the Data Integration area, the updates focus on improving the performance and reliability of data replication processes. Read on to learn more about the new additions in July.
>> Read more
What was new at Qlik Connect?
A couple of weeks after returning home from Qlik Connect in Orlando it’s time to summarize all the impressions from the conference. Our BI Manager and Qlik Partner Ambassador Olof Malmström shares the highlights.
>> Read more
Qlik a Leader in the 2024 Gartner Magic Quadrant for Data Analytics and Business Intelligence
Get your free copy for an overview of the entire Data Analytics and BI landscape and see why Qlik is recognised as a Leader in the Magic Quadrant for 14 years straight.
>> Download the report