

Maximise BI value and increase data literacy with the Qlik Usage Monitoring Application
Building a valuable Business Intelligence solution is a challenging task. Only 51 % use their Qlik solution on a daily basis, even though 63 % believe that it’s a business critical solution. Providing data is obviously not enough to get your employees on board, and no guarantee that people will actually use BI. So, how do you increase employee engagement? The key lies in boosting data literacy. By measuring how your BI solution is being used you’ll get an indication of the best course of action for that. And, you as an organisation can optimize your applications based on how they are performing.
Want to learn more about Data Literacy?
Do you want to know more about the opportunities a data-driven culture can deliver and get hands-on tips of how to achieve this? Sign up to take part of Qlik’s latest webinar on the topic, The Human Impact of Data Literacy. Learn about the 3 main barriers to become data-driven and get 5 practical steps for building a data-informed workforce.
Understand users, usage and usage patterns
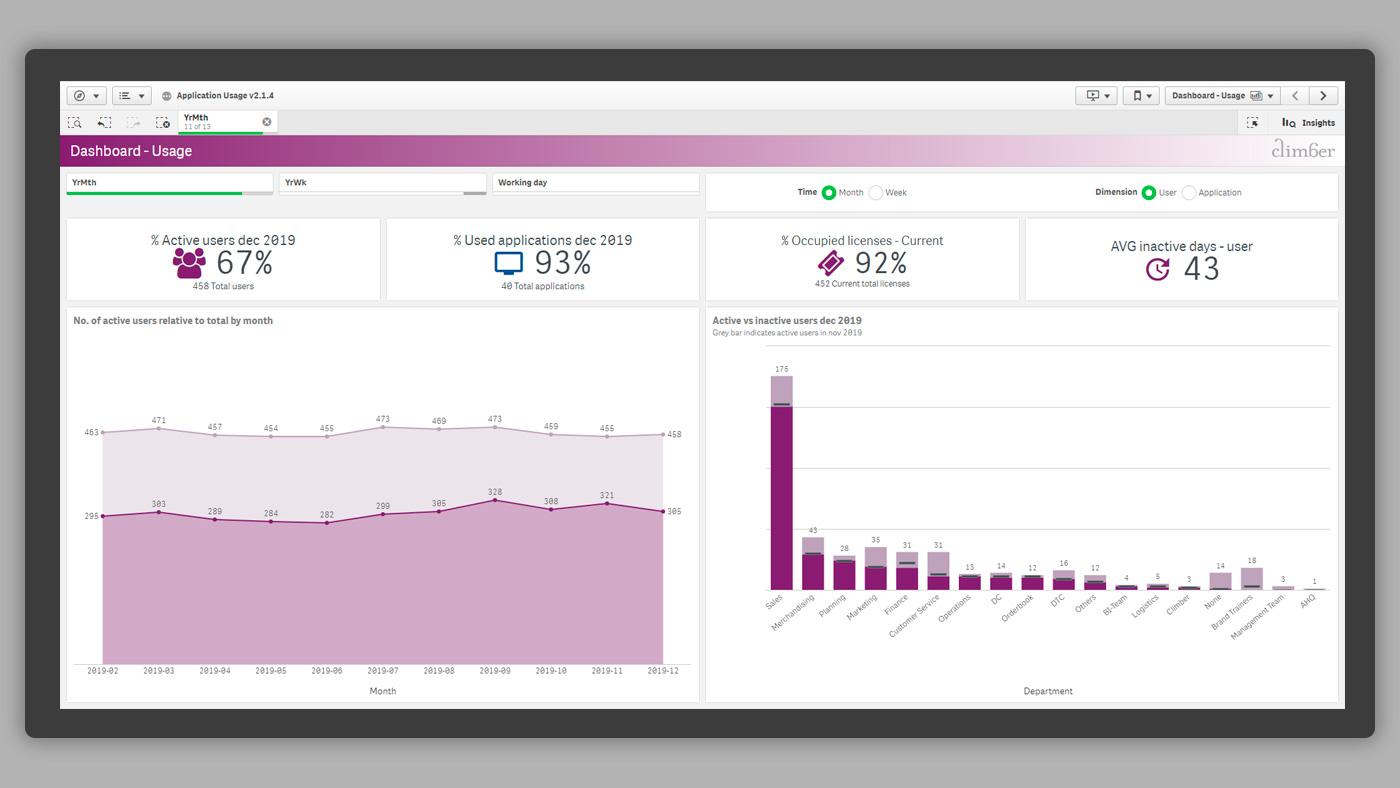
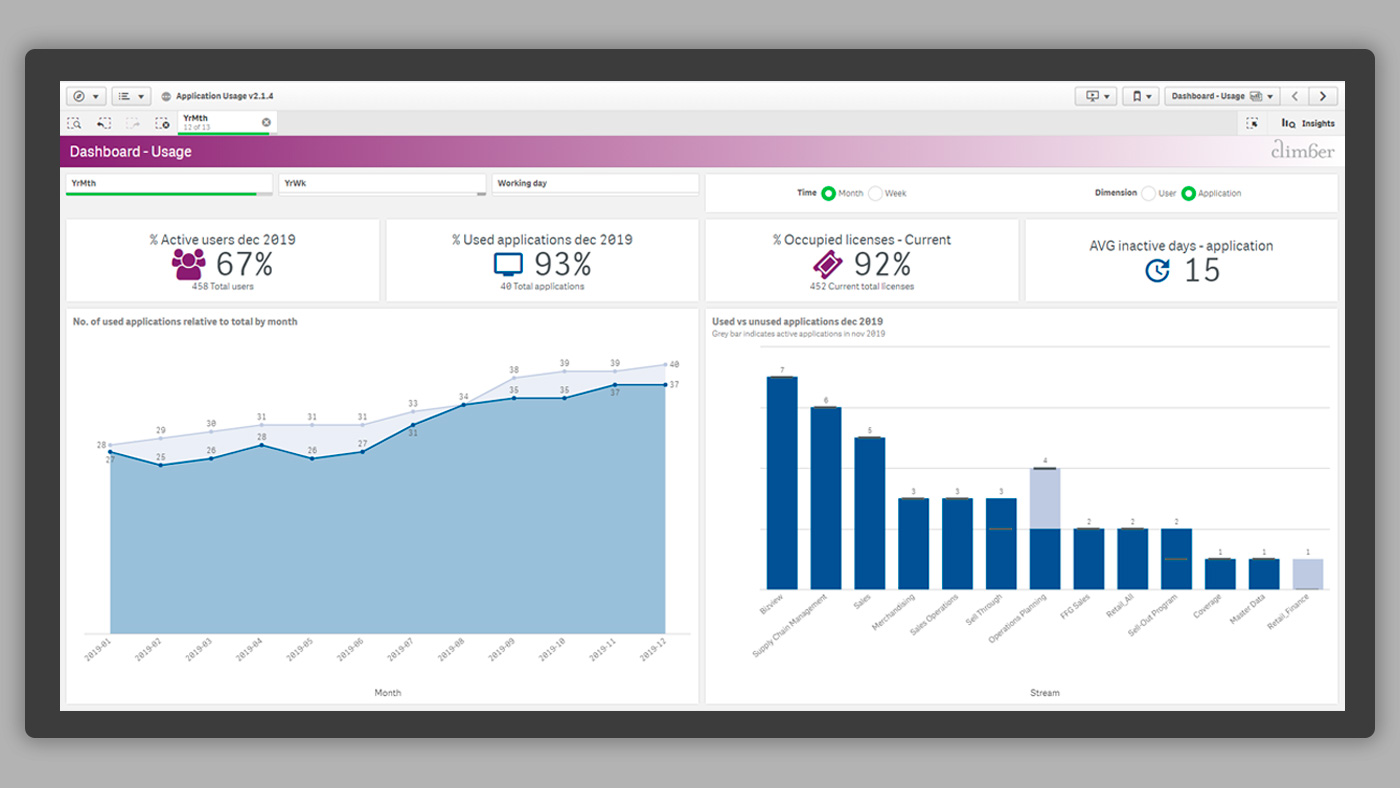
Obviously, the reasons why a user isn’t utilizing Qlik can vary. Perhaps they can’t find the answers to their questions, or need training to be able to analyze their findings. The Qlik Usage Monitoring Application (Usage Monitor) is a Qlik Sense application that answers questions such as; Which dashboards are being used frequently? Who interacts with which dashboards? How often – and for how long? The Qlik Usage Monitor will help you understand in what frequency and reach the users interact with Qlik and reveal possible improvements. For example, you can evaluate whether certain dashboards have fulfilled their purpose, and remove them to reduce maintenance costs. This continuous feedback from your users, will make sure that your Qlik solution remains efficient and up to date.
The Qlik usage monitor displays your Qlik Sense log files
How does it work then? All Qlik Sense environments create metadata that’s kept in log files. These files are stored in the application and aren’t accessible to a regular user. The metadata is great for exploring and identifying who’s using – or not using – the applications. The Qlik Usage Monitoring Application displays the log files, makes it possible for you to explore the metadata in real time, and provides insights that will help you boost data literacy within your organisation.
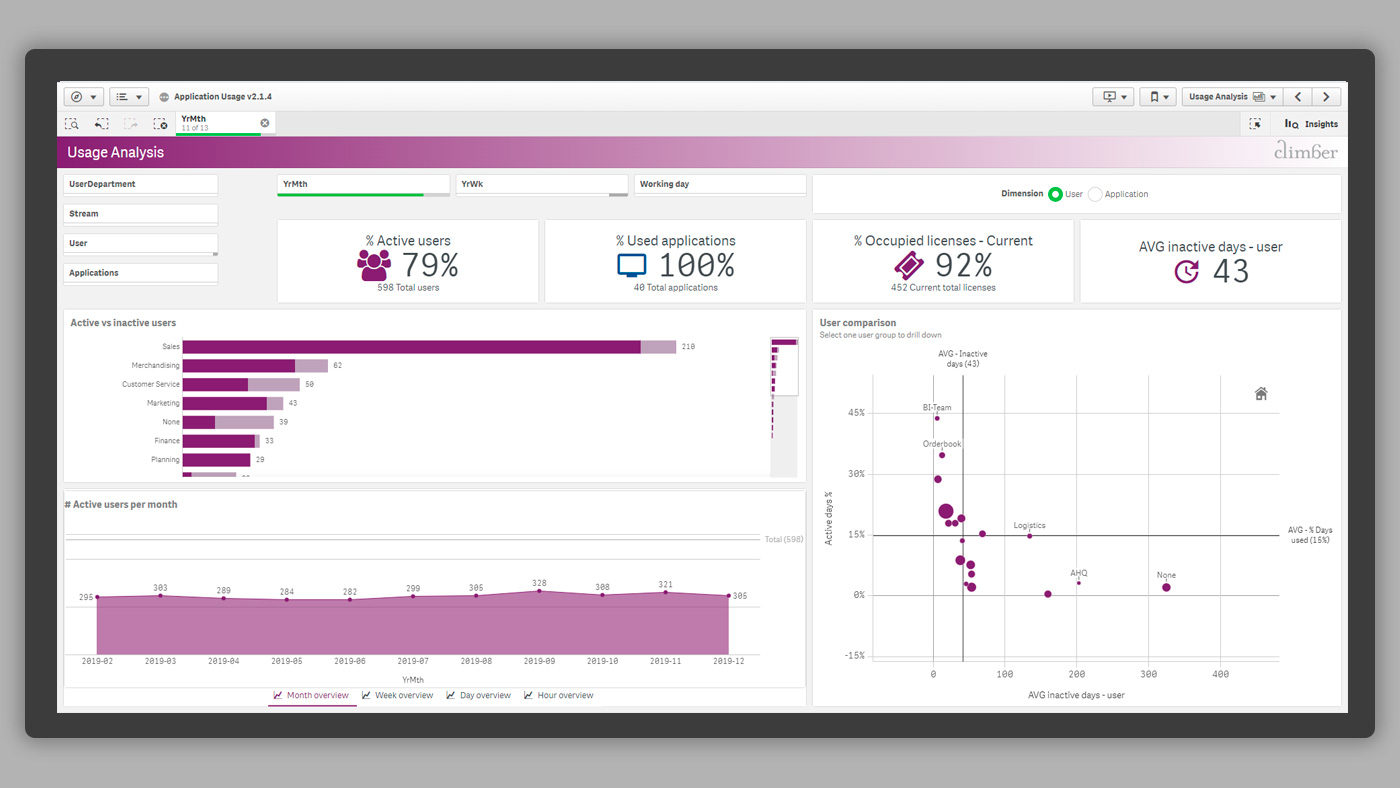
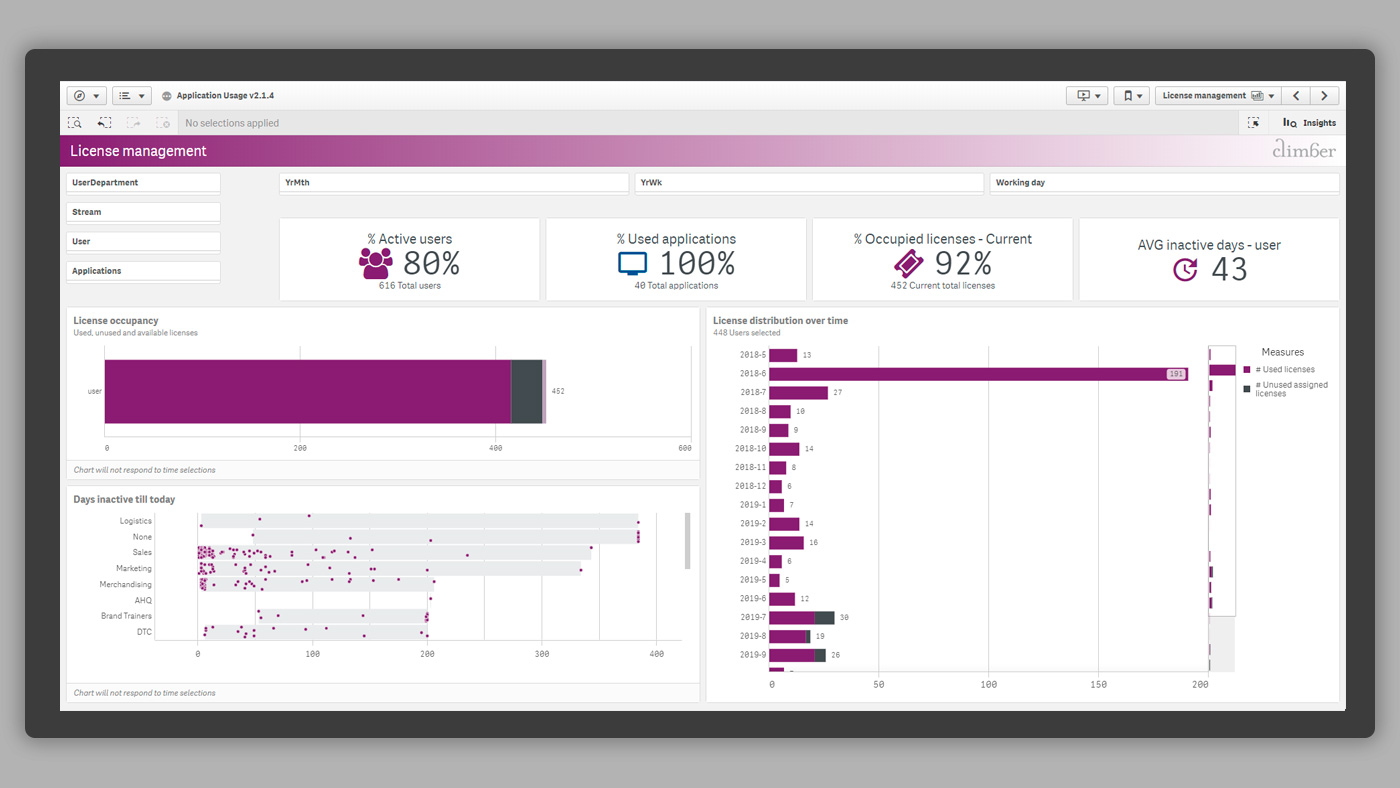
Optimize license allocation to get the most of your Qlik investment
The Qlik Usage Monitor assists in constantly improving your Qlik solution to increase ROI. Quantifying a BI investment is no exact science. But the Qlik Usage Monitor provides valuable insights of usage patterns and license allocation, and will help you discover and resolve any bottlenecks. By following up on usage, you can maintain the dashboards that are significant to your business more efficiently, and systematically optimize your Qlik solution to get the most of your investment.
Contact us to learn more about the Usage Monitoring Application.
Writer: Rick Blaauw – BI Consultant Climber

News

NIS2 är här – och det handlar om mer än du tror
Vad innebär NIS2, vilka bolag berörs? Vad betyder det för er dagliga datahantering, era backup-rutiner och er styrning av informationssäkerhet? Det och mer får ni svar på här!
>> Läs bloggen!
What’s New in Qlik Cloud – March 2026
An exciting update this month is Qlik’s new agentic experience in Qlik Cloud, delivered through Qlik Answers as a unified conversational interface. Qlik also continues to strengthen Qlik Talend Cloud across both architecture and day-to-day operations.
>> Read more
What’s New in Microsoft Fabric – February 2026
The February 2026 update of Microsoft Fabric delivered a mix of new capabilities now generally available (GA) and preview features across OneLake, real-time analytics, DevOps, SQL, and connectors.
>> Read more