
CHECK OUT OUR NEW P&L EXTENSION for QLIK SENSE
The P&L statement is the go-to report for getting a high-level view of a business’s finances. Think of it as a health report card for your business. And one in real-time, with a more professional, attractive, key-info-at-a-glance look & feel, will make your CFO even happier. We are stoked to be launching the Climber P&L Extension for Qlik Sense, an easy-to-use, flexible solution that will make your P&L reporting much faster and more informative. The extension adds the P&L to your BI solution, making it easier to analyze your P&L, and drill-down to details while connecting it to your overall operations. The base for the extension is a regular pivot table, which also accommodates balance sheets and other formatted tables. Check out the tutorial above to see how it works! The Climber P&L is available through a monthly subscription. Learn more and contact us here.
CHANGE DIMENSIONS,
DRILL-DOWN AND EXPORT
Our new P&L extension is based on a regular pivot table, allowing you to use either a top dimension or group the expressions together. You can also use drill-down dimensions and make selections by simply clicking on a row. Likewise, the extension allows you to:
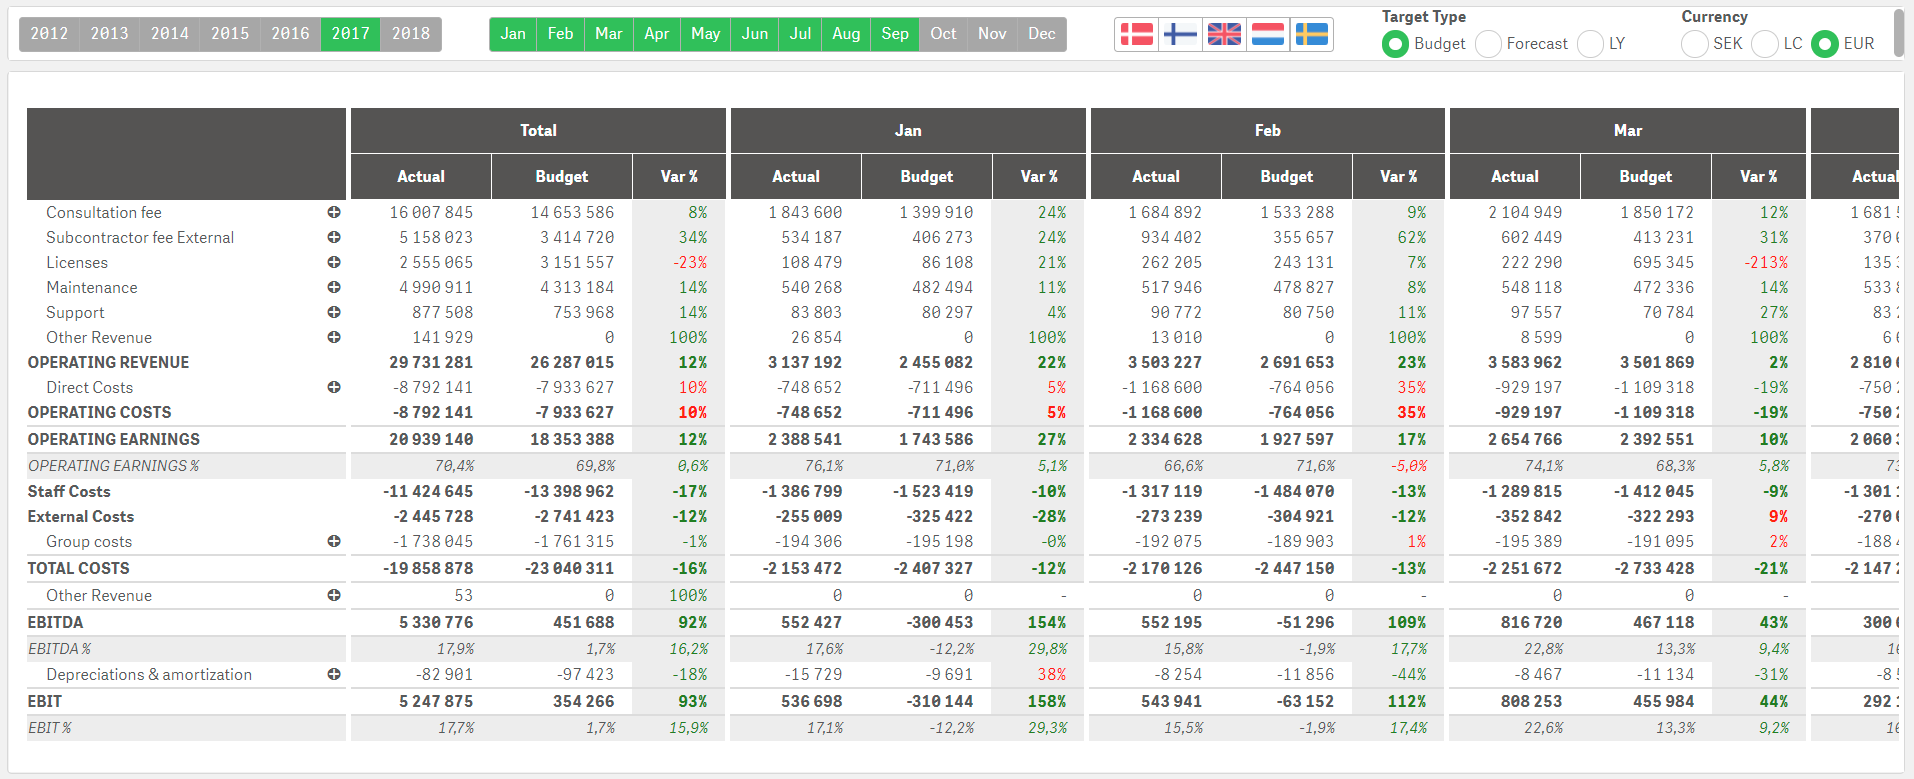
- Use alternative dimensions for both the first, the sub-row and the top dimension. You can also use different P&L setups and switch between time periods.
- Include KPI-rows to give the user an easy indication of, for example, percentage of operating income.
- Right-click to export the P&L to Excel, while keeping the same formatting.
- Add comments and create a reporting hierarchy using the Climber Comments Extension, which the extension stores in a database, making possible to see who created each comment and when. For example, business units can comment on their numbers, country managers can add their input and everything is combined at a corporate level.
Discover our other
Qlik Sense Extensions!
We have created a number of other extensions for a complete finance solution in Qlik Sense, which make data selection easier while providing you with immediate, real-time snapshots of your KPIs and enabling you to create custom reports. They are available through monthly subscription. Learn more about all Extensions for Qlik Sense here and how to subscribe.
Custom Report: Create custom reports based on data in the master tables. The extension allows each user to choose which data to add in their report.
KPI Extension: Generates a clear presentation of KPIs, including trendlines and makes it easy to navigate from your dashboard to details on other sheets.
Selection Bar: Simplifies your selections enabling you to make more accurate analyses.
Cards Extension: Enables you to showcase items with images for a neater looking dashboard.
Want a demo of the P&L extension for Qlik Sense? Contact us!
Please get in touch if you want a demo of the P&L or want more information about any of our Qlik Sense extensions.
Eva Chrona
CEO Climber Group
eva.chrona@climber.se
+46 70 960 03 54
Jonas Grundström
Sales & Business Development Director
jonas.grundstrom@climber.se
+46 73 340 26 36
News

What’s New in Qlik Cloud – July 2026
Alongside the regular round-up of analytics and data integration updates, June saw one of the most significant announcements in Qlik Cloud’s roadmap to date: the general availability of agentic data engineering capabilities across the entire platform.
>> Read more
Qlik a Leader in the 2026 Gartner Magic Quadrant for Analytics and Business Intelligence Platforms
Get your free copy for an overview of the entire Analytics and Business Intelligence landscape and see why Gartner has recognised Qlik as a Leader in the Magic Quadrant for the 16th consecutive year.
>> Download the report
Fabric Apps Change How Organisations Build Data-Driven Applications
With the introduction of Fabric Apps, Microsoft Fabric is no longer just becoming a place to analyse data. It is becoming a platform for building complete business applications.
>> Read more